
OverviewThis page contains links to the results of running the Dawson (2013) merger Monte Carlo dynamics analysis method on various merging clusters. The end result of this method is a 13-dimensional posterior PDF of an array of cluster merger parameters (see e.g. the figure to the right and figure below). In addition to these summary figures we also provide the Monte Carlo samples (~2,000,000) for each of the 13 merger parameters. This enables anyone to apply additional priors ex post facto and accurately measure the effects.
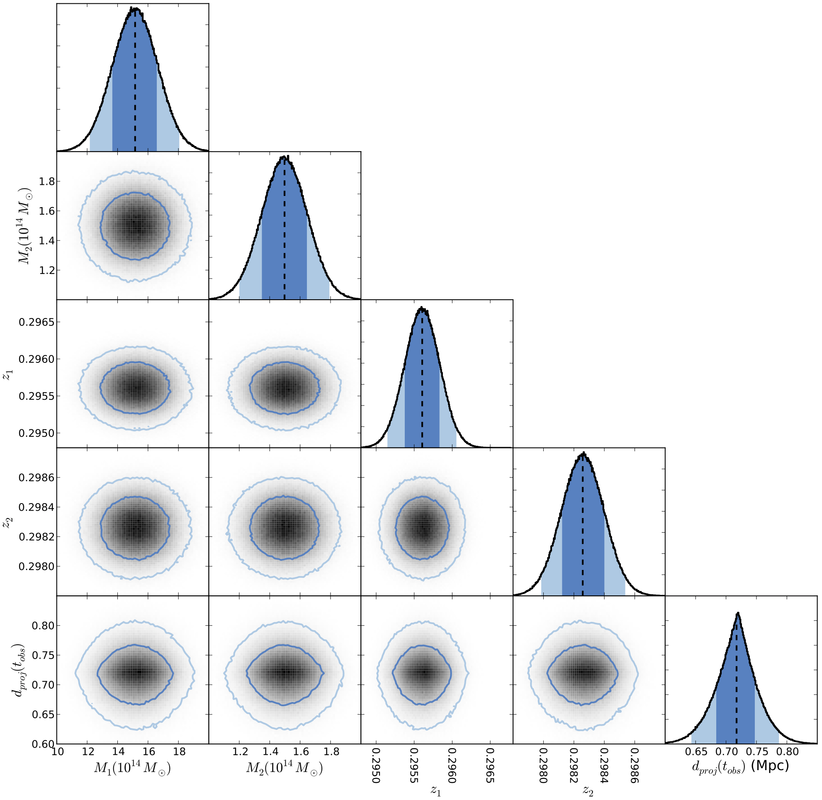
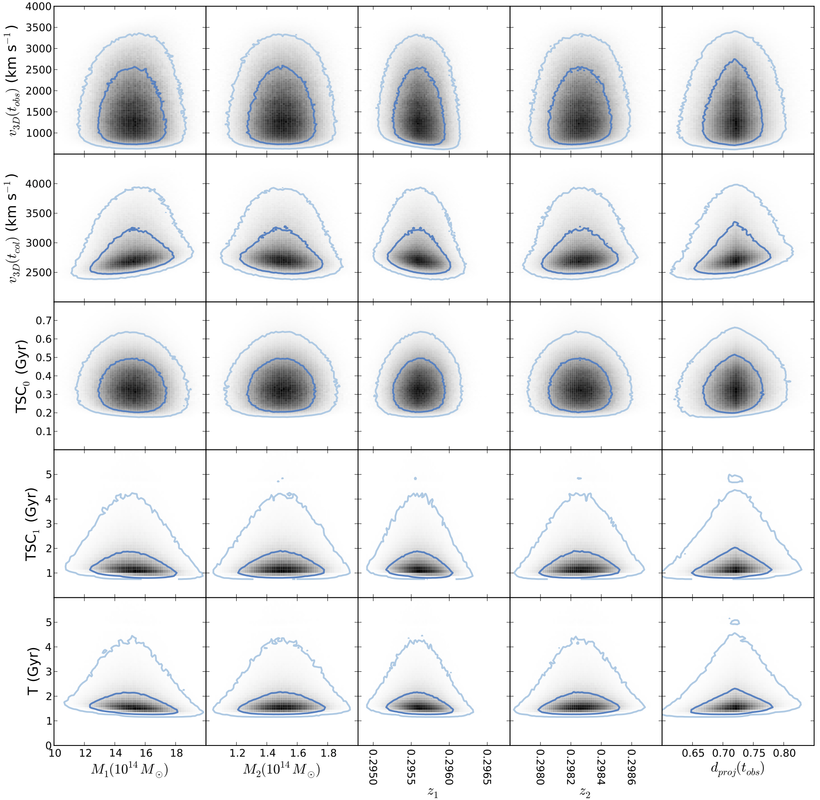
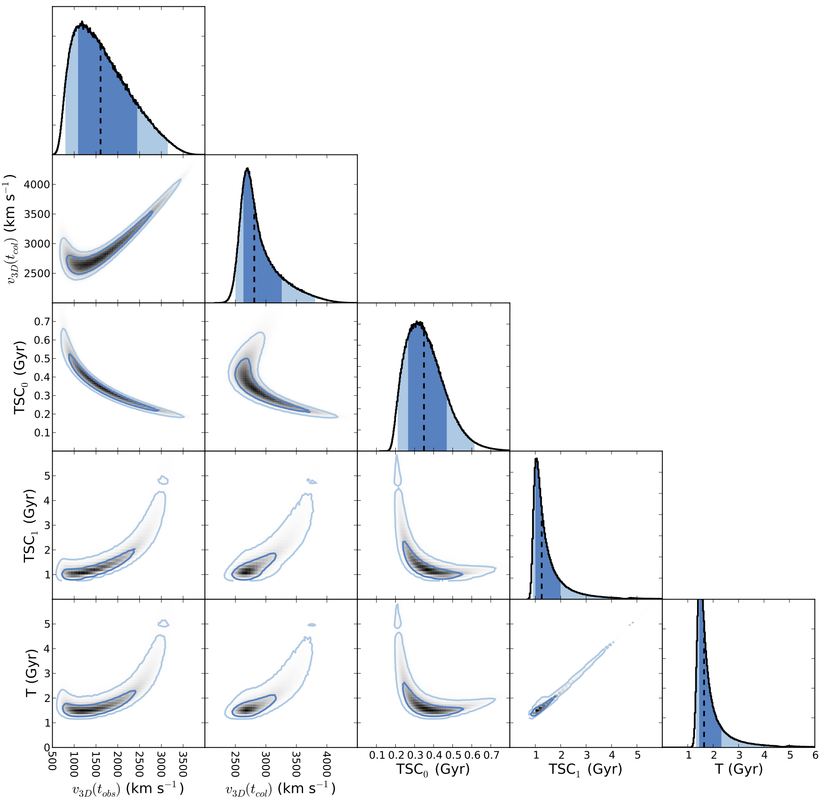
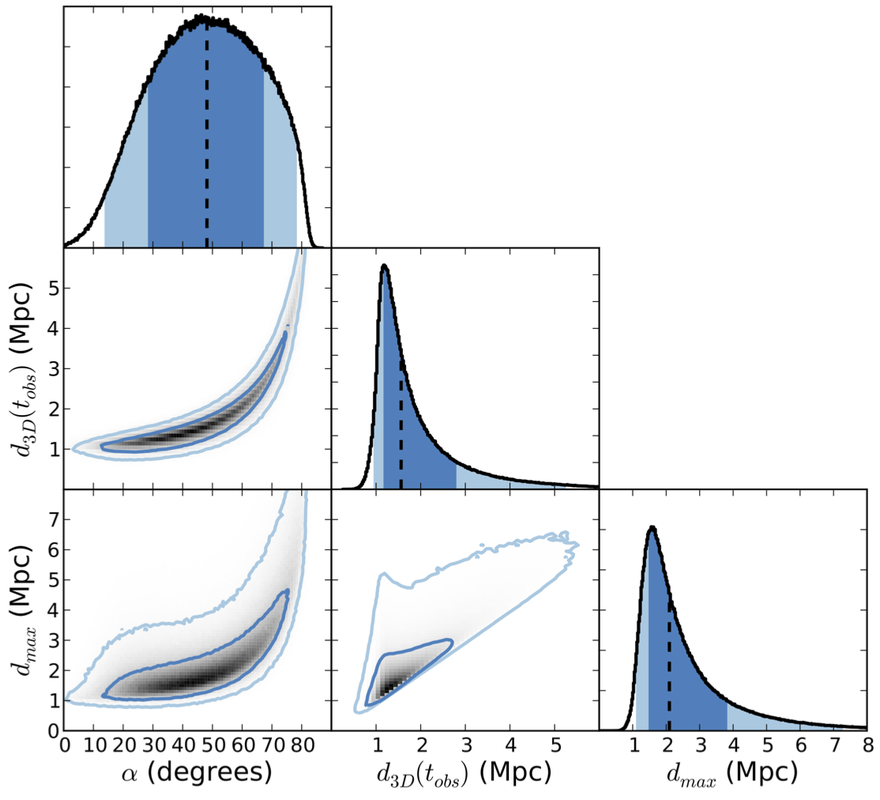
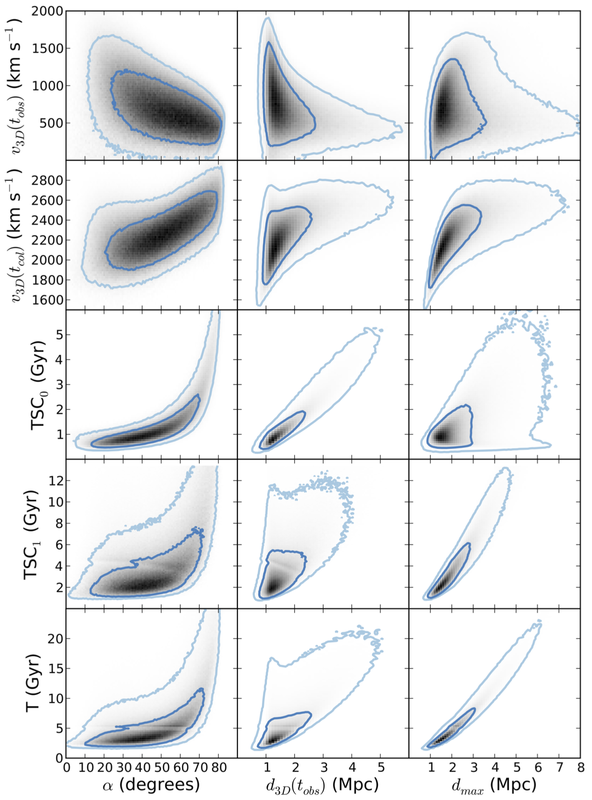
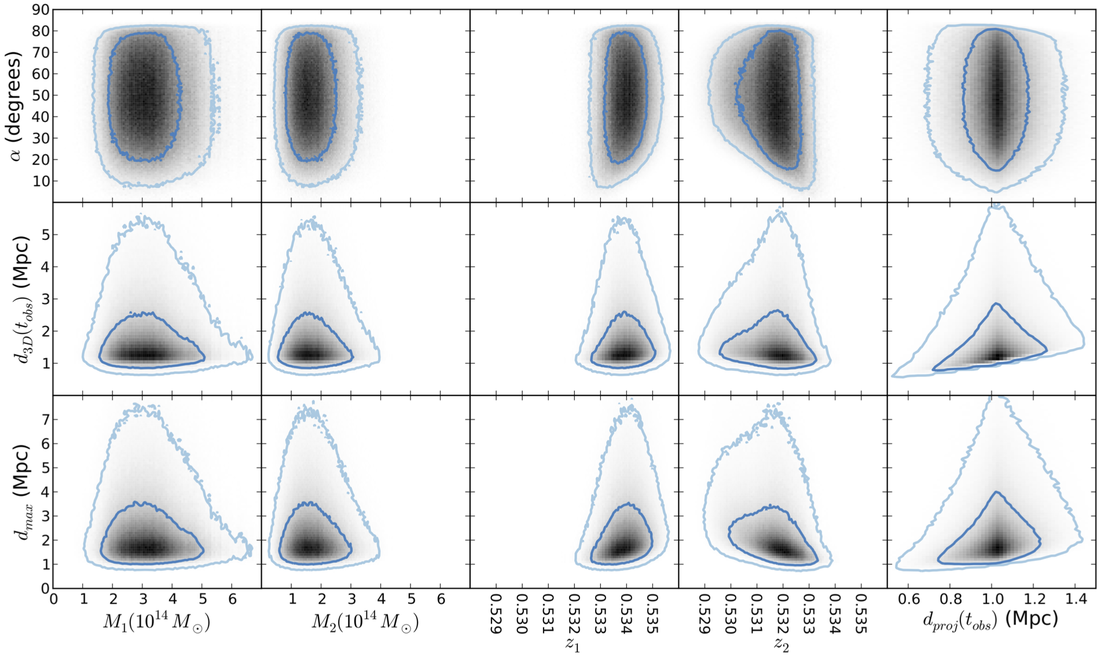
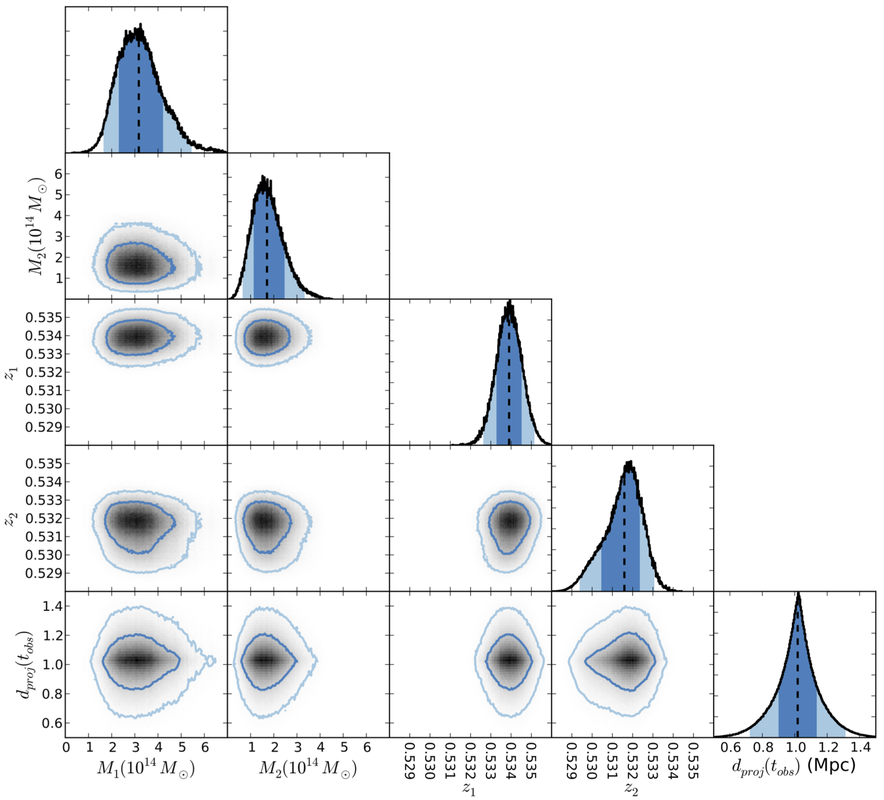
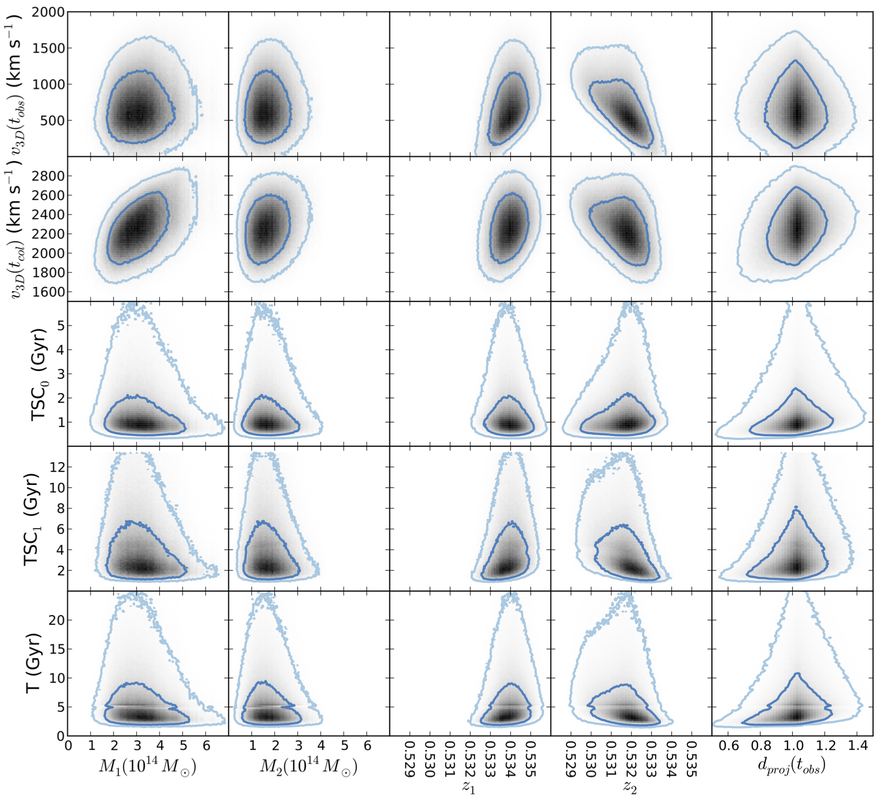
The 13 merger parameters include: the mass of each subcluster (M1, M2), redshift of each subcluster (z1, z2), separation of each subcluster in the observed state (d-projected and d-3D), maximum 3D separation (d-max), angle of the merger with respect to the plane of the sky (alpha), 3D relative velocity of the subclusters in the observed state (v-obs) and at the time of collision (v-col), the time since collision assuming outgoing (t-0) and return (t-1) passage, and the collision period (T). See Dawson (2013) for a more thorough description of the parameters. |
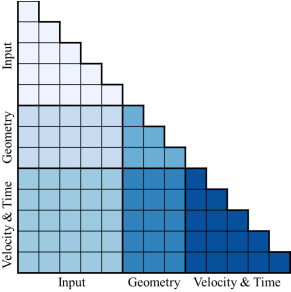
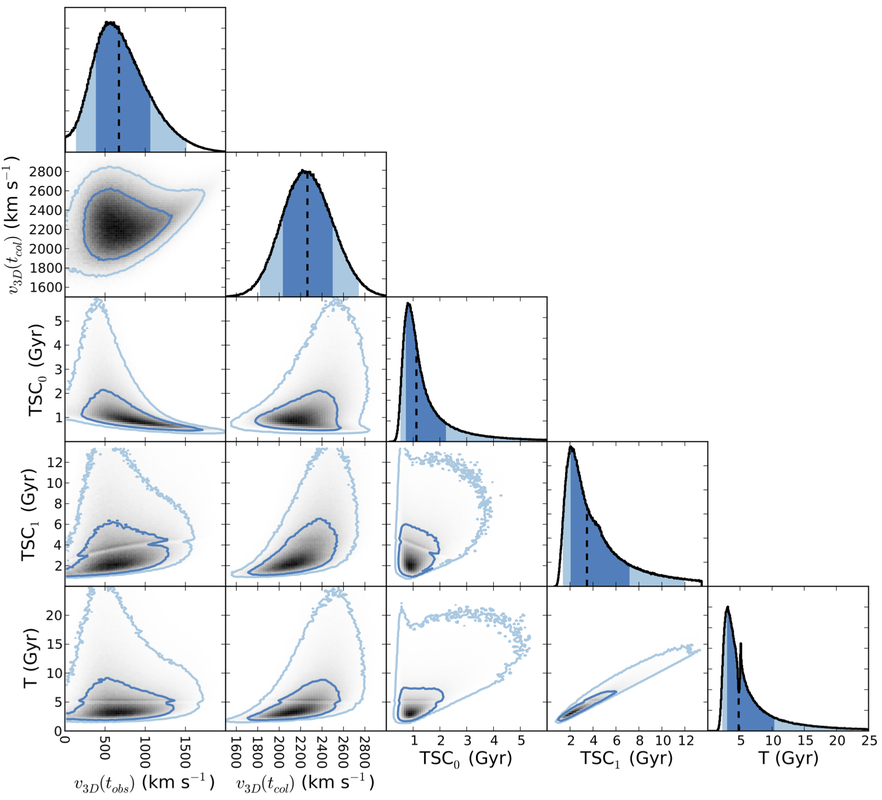
For ease the covariance result array plots are divided into six subplots. The Input parameters consist of M_200_1 , M_200_2 , z1 , z2 , and d_proj . The calculated Geometry parameters consist of α, d_3D, and d_max. The calculated Velocity & Time parameters consist of v_3D(t_obs), v3_D(t_col), TSC0, TSC1, and T.
|
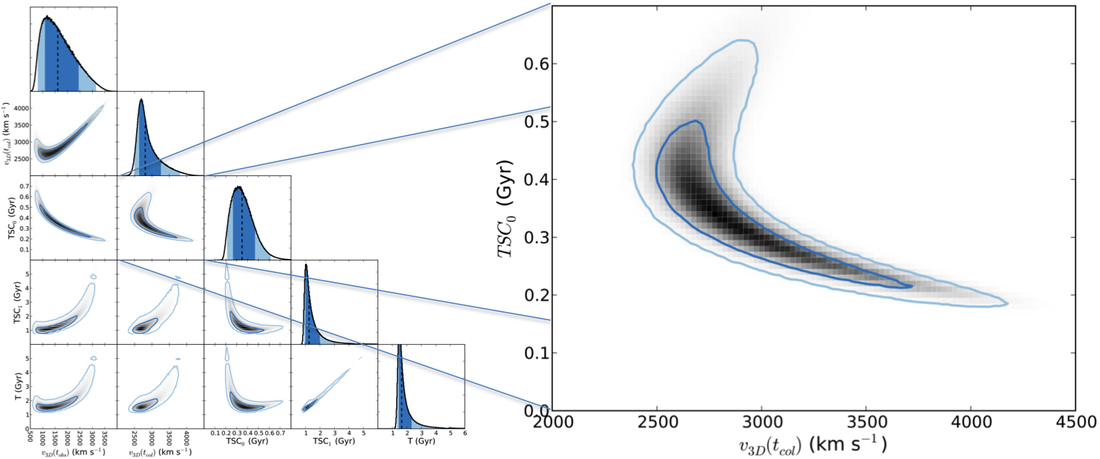
Results from our dynamic analysis of the Bullet Cluster showing the posterior distributions for a subsample of the dynamics parameters (Dawson 2013a), with a zoom of the time-since-collison (TSC) and collision velocity after marginalizing over 11 other merger parameters. This demonstrates that the merger parameters are highly correlated, often in complex ways. Dark and light blue contours represent 68\% and 95\% confidence, respectively.
Monte Carlo Sample Data
Bullet Cluster
|
|
| ||

Musket Ball Cluster
|
|
| ||
References
Dawson, W.A., 2013. The Dynamics of Merging Clusters: A Monte Carlo Solution Applied to the Bullet and Musket Ball Clusters. The Astrophysical Journal.