
Abell 2034
| RA | Dec | z |
|---|---|---|
| 15:10:11.7 | +33:30:53 | 0.115 |
Summary
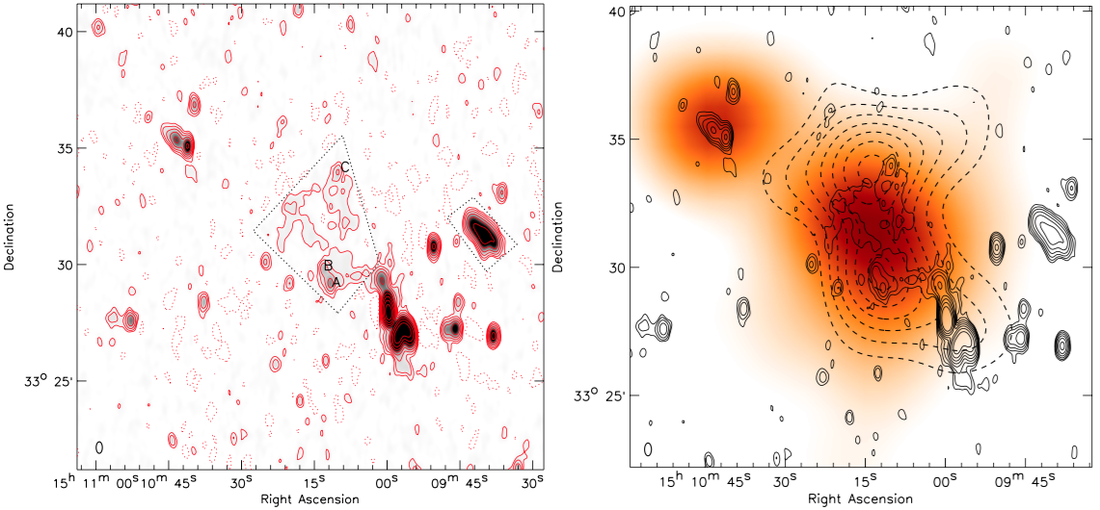
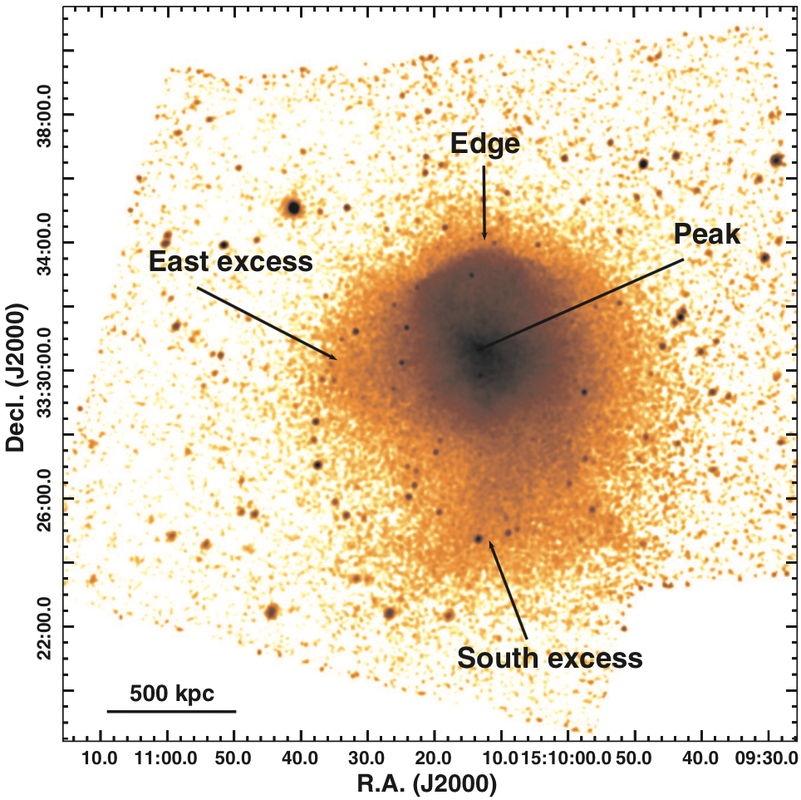
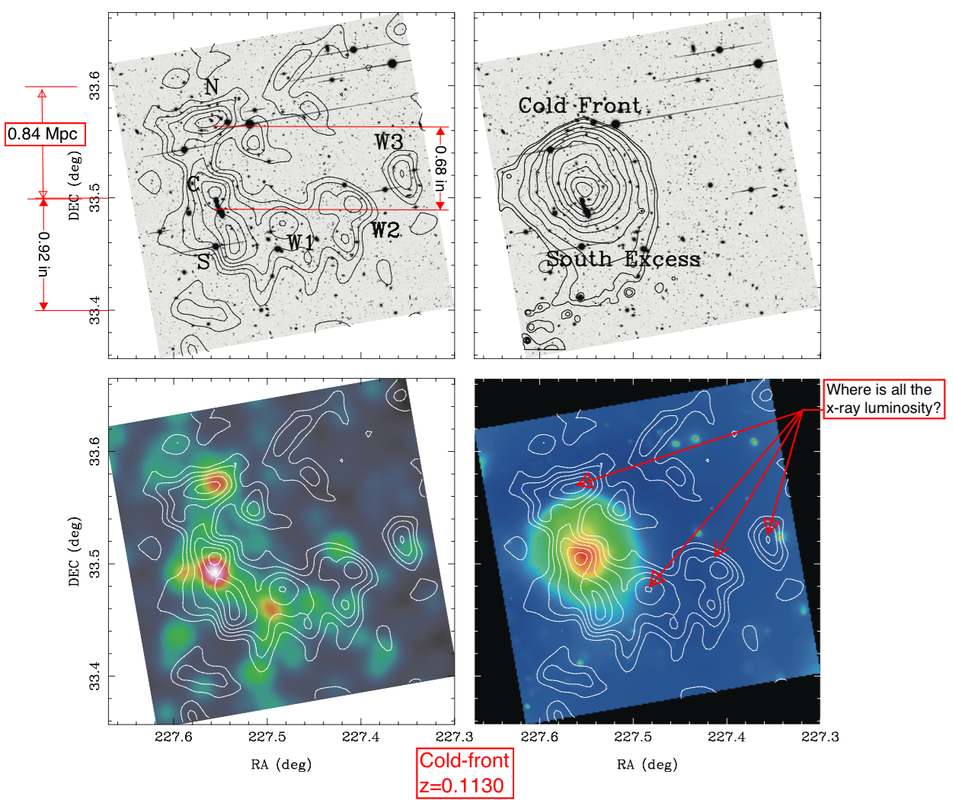
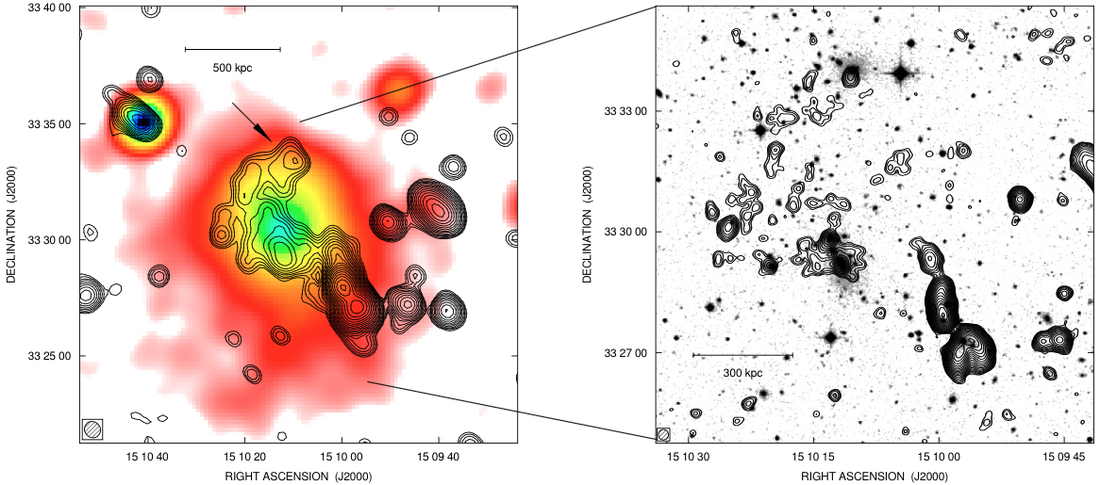
Kempner & Sarazin (2001) noted faint extended WENSS radio emission north of the cluster center coincident with a discontinuity in the RASS X-ray image. Kemper et al. (2003) used Chandra identify an cold front near this location and confirm that A2034 is a merging cluster. Giovannini et al. (2009) identified diffuse radio emission coinciding with the center of the cluster but noted that it appears elongated and irregular with respect to other radio halos. They also confirmed the diffuse radio emission north of the cluster (but connected to the other diffuse emission) and its coincidence with he X-ray cold front. With deeper Chandra data Owers et al. (2014) show that this cold front is actually a shock with a Mach number of 1.59+/-0.06 corresponding to a shock velocity of ~2057 km/s.
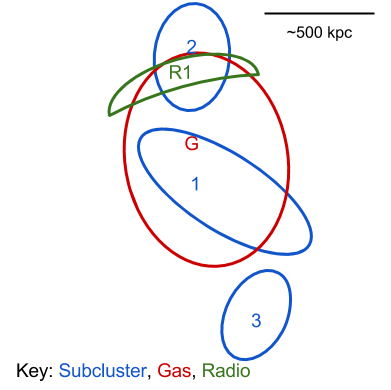
With WSRT van Weeren et al. (2011) observed the diffuse emission to brighten near the position of the shock. They note that it is debatable whether this really is a radio relic. They also identify a small radio relic (~200 x 75 kpc) to the west of the cluster center. van Weeren et al. (2011) also note that the galaxy distribution appears bimodal, with two relatively equal distributions. However, Okabe et al. (2009) find a more complex (but not entirely inconsistent) galaxy distribution based on the luminosity density maps using Subaru imaging. Owers et al. (2014) use 328 spectroscopically confirmed cluster members to show that there is a substructure located at the front edge of the shock and that the galaxy distribution is more complex. Given the redshifts of this northern and main structures as well as the X-ray shock velocity they estimate the the merger is occurring along an axis within ~23 degrees of the plane of the sky and observed ~0.3 Gyr after core-passage.
Okabe & Umetsu (2008) estimate a weak lensing based mass for A2034 of 10.24 +/- 6.14 e14 Msun, which is consistent with the Geller et al. (2013) spectroscopic velocity caustic estimate of 8.0 +/- 0.1 e14 Msun. Note that all of these mass estimates treat A2034 as a single system when estimating the mass. The Planck and Arcminute Microkelvin Imager collaborations (2013) estimate an SZ Y500 of 33 +/- 6 e-4 arcmin^2 from Planck and 24 +/- 14 e-4 arcmin^2 from AMI.
Kemper et al. (2003) also argued that the observed southern X-ray excess is not associated with the cluster and likely some background cluster between 0.3 < z < 1, however Owers et al. (2014) say that the excess is consistent with it being gas striped during the merger.
Based on Owers et al. (2014).
|
Existing Data
|
Optical Imaging
|
Spectra
|
X-ray
|
Radio
|
Gallery

References
- Kempner, J.C. & Sarazin, C.L., 2001. Radio Halo and Relic Candidates from the Westerbork Northern Sky Survey. The Astrophysical Journal, 548(2), pp.639–651.
- Kempner, J.C., Sarazin, C.L. & Markevitch, M., 2003. Chandra Observation of the Merging Cluster A2034. The Astrophysical Journal, 593(1), pp.291–300.
- Jeltema, T.E. et al., 2005. The Evolution of Structure in X‐Ray Clusters of Galaxies. The Astrophysical Journal, 624(2), pp.606–629.
- Okabe, N. & Umetsu, K., 2008. Subaru Weak Lensing Study of Seven Merging Clusters: Distributions of Mass and Baryons. Publications of the Astronomical Society of Japan, 60, pp.345–.
- Giovannini, G. et al., 2009. Radio halos in nearby ( z. Astronomy and Astrophysics, 507(3), pp.1257–1270.
- van Weeren, R.J. et al., 2011. Radio continuum observations of new radio halos and relics from the NVSS and WENSS surveys. Astronomy and Astrophysics, 533, p.A35.
- Geller, M.J. et al., 2013. Measuring the Mass Distribution in Galaxy Clusters. Astrophysical Journal, 764(1), p.58.
- Planck Collaboration, 2013. Planck intermediate results. II. Comparison of Sunyaev-Zeldovich measurements from Planck and from the Arcminute Microkelvin Imager for 11 galaxy clusters. Astronomy and Astrophysics, 550, p.128.
- Owers, M.S. et al., 2014. A Merger Shock in A2034. Astrophysical Journal, 780(2), p.163.
* Lensing quality imaging
^ Galaxies with spectroscopic redshifts near the cluster within a radius of 2 Mpc of the system center.
^ Galaxies with spectroscopic redshifts near the cluster within a radius of 2 Mpc of the system center.